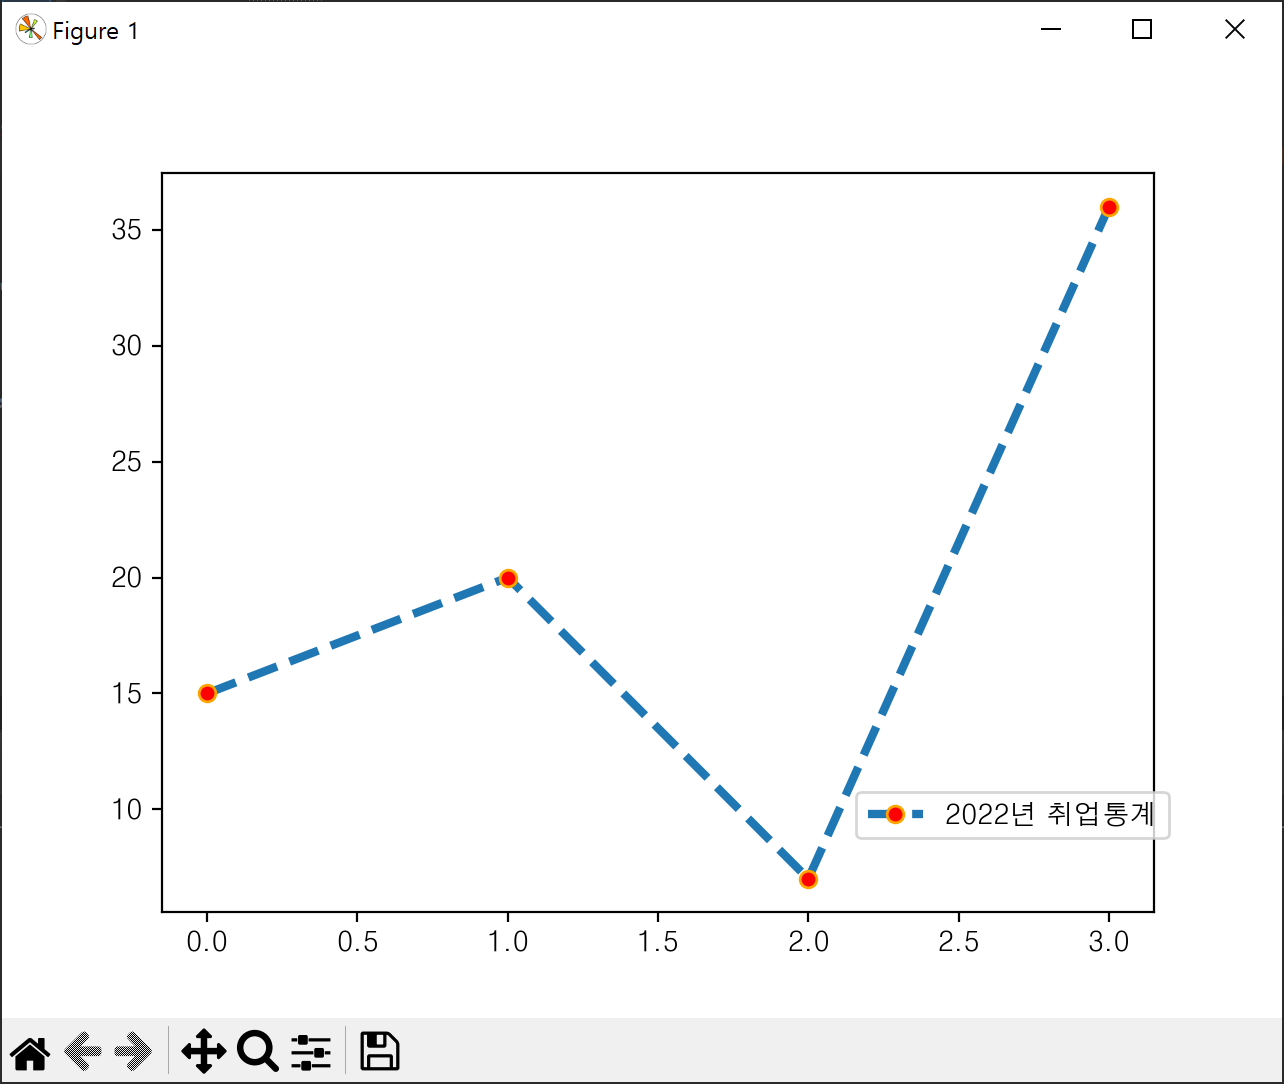
전체코드
import matplotlib.pyplot as mpt #그래프모듈
import mfont

x=[15,20,7,36]
#linewidth:선 두께 1=px
#marker:동그라미 찍힘
#o:원 v:삼각형 x:x모양 *:*모양
#marker: 공식사이트에 설명있음 https://matplotlib.org/stable/gallery/lines_bars_and_markers/marker_reference.html
#markerfacecolor:배경
#markeredgecolor:테두리
#linestyle:solid, dashed, dotted
#color:선 색상
#mpt.plot(x, linestyle='dashed',label="2022년 취업통계",linewidth=3,marker='o',markeredgecolor='orange',markerfacecolor="red")

#축약어
mpt.plot(x, linestyle='dashed',label="2022년 취업통계",linewidth=3,marker='o',mec='orange',mfc="red")
mpt.legend(loc=(0.7,0.1)) #label 위치 표현
#loc=(x축,y축) = 0~1사이 값
#dpi(100기본):200, 300
#savefig:저장하는 함수
mpt.savefig('graph1.png')
mpt.show() #맨밑에서 실행
#linewidth:선 두께 1=px
#marker:동그라미 찍힘
#o:원 v:삼각형 x:x모양 *:*모양
#marker: 공식사이트에 설명있음
>> https://matplotlib.org/stable/gallery/lines_bars_and_markers/marker_reference.html
#markerfacecolor:배경
#markeredgecolor:테두리
***그래프 이미지 저장
#loc=(x축,y축) = 0~1사이 값
#dpi(100기본):200, 300
#savefig:저장하는 함수

728x90
'Python > matplotlib' 카테고리의 다른 글
| Python m14 다양한 그래프 4개 (0) | 2022.10.04 |
|---|---|
| Pandas m4 #enumerate (동그라미 텍스트) #ha (0) | 2022.09.28 |
| Pandas m2 그래프 thicks 표현 방식 #ticks #loc (0) | 2022.09.28 |
| Pandas m1 #그래프모듈 #plot #title #show() (0) | 2022.09.28 |


댓글