
전체코드
#matplotlib:그래프 형태 자료형 + numpy
import matplotlib.pyplot as mpt #그래프모듈
import mfont


x=[1,3,5] #가로
y=[-2,4,6] #세로
mpt.plot(x,y) #숫자리스트를 그래프로
mpt.title("테스트 그래프") #그래프 화면 타이틀
mpt.show() #그래프 모듈화면 출력


data=[10,6,4,7,3,2,9]
#data = [1,5,9,10,2]
mpt.plot(data)
mpt.show()
#matplotlib:그래프 형태 자료형 + numpy
import matplotlib.pyplot as mpt #그래프모듈
import mfont


x=[1,3,5] #가로
y=[-2,4,6] #세로
mpt.plot(x,y) #숫자리스트를 그래프로
mpt.title("테스트 그래프") #그래프 화면 타이틀
mpt.show() #그래프 모듈화면 출력
data=[10,6,4,7,3,2,9]
#data = [1,5,9,10,2]
mpt.plot(data)
mpt.show()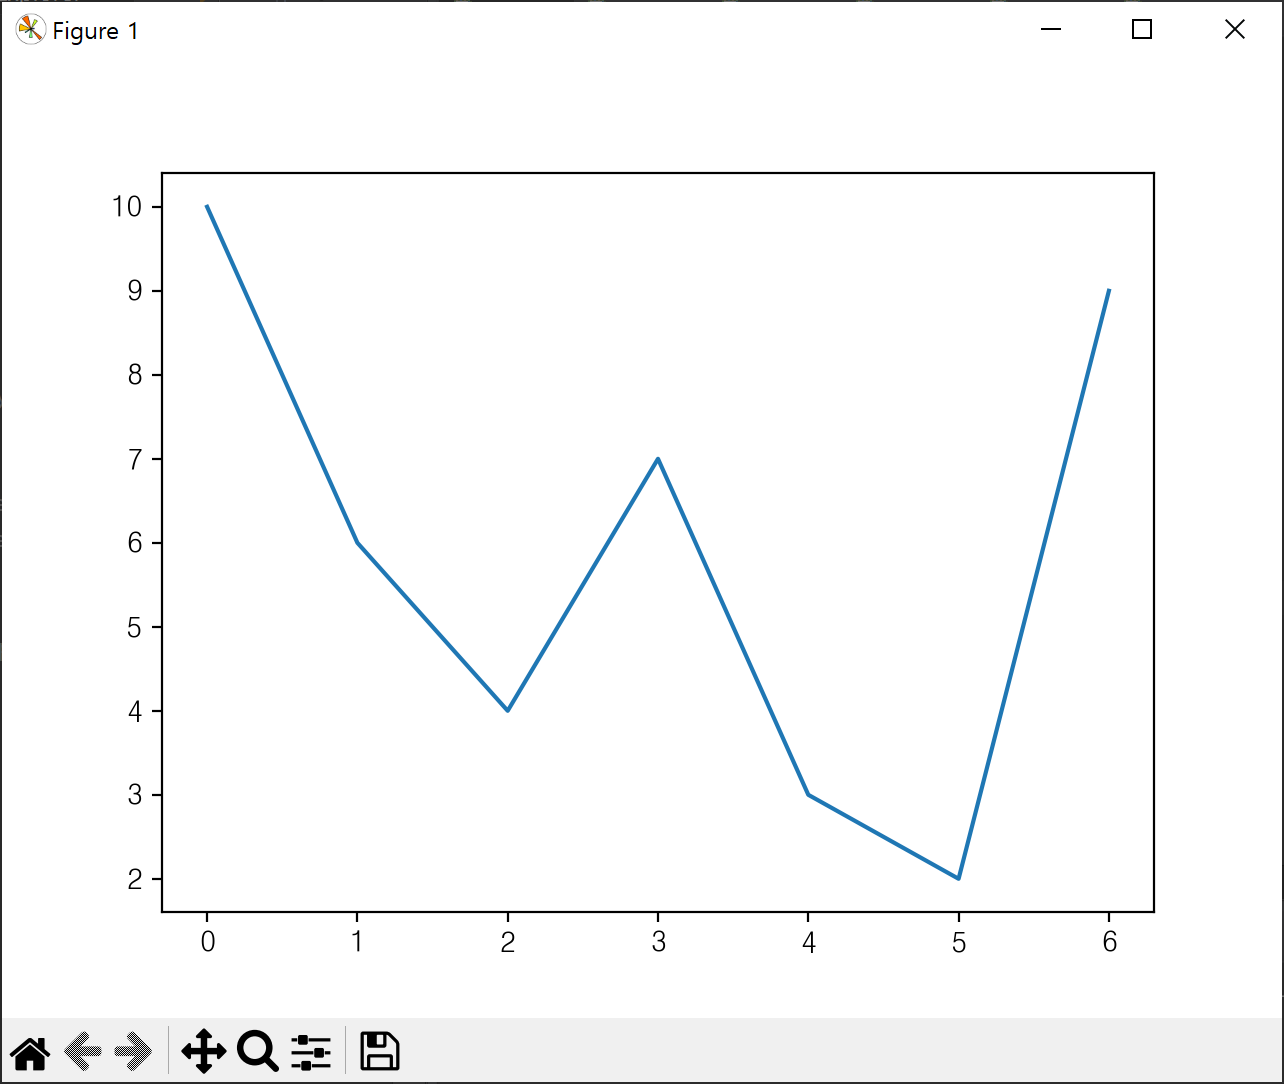
728x90
'Python > matplotlib' 카테고리의 다른 글
| Python m14 다양한 그래프 4개 (0) | 2022.10.04 |
|---|---|
| Pandas m4 #enumerate (동그라미 텍스트) #ha (0) | 2022.09.28 |
| Pandas m3 #그래프모듈 #linewidth #marker #savefig (0) | 2022.09.28 |
| Pandas m2 그래프 thicks 표현 방식 #ticks #loc (0) | 2022.09.28 |


댓글